|
|
Synoptic tables
Different types of synoptic tables can be displayed with the results of TWINSPAN, COCKTAIL or user-defined classifications. Subsequent fidelity sorting allows the creation of structured tables with a hierarchy of diagnostic species.
Fidelity is the concentration of species occurrence in vegetation units. In fidelity calculations, we count each relevé in which the species is present as an occurrence of the species, disregarding any information about its abundance or density. We compare the distribution of these occurrences within the data set to what would theoretically be expected if such occurrences were independent of the vegetation unit the relevé is taken from. Species occurring mostly in the vegetation unit but rare or absent outside have a high positive fidelity value, whereas species absent in the vegetation unit but frequent outside have negative fidelity value.
Several measures of fidelity (Chytrý et al. 2002) are available in JUICE. They include chi-square (Sokal & Rohlf 1995), G statistic of the likelihood ratio test (Sokal & Rohlf 1995; Botta-Dukát & Borhidi 1999), u value (Bruelheide 1995, 2000) which is calculated for two forms of the binomial model and for hypergeometric model, Fisher’s exact test (Sokal & Rohlf 1995), and phi coefficient (Sokal & Rohlf 1995). Chi-square, G statistic, and u value can be calculated both as adjusted, i.e. corrected for continuity, or unadjusted. Continuity correction is particularly recommended when working with small datasets or with vegetation units or species which have few occurrences in the dataset.
Chi-square and G statistic range from zero to infinity. Square-roots of these measures are used in the program. In case of negative fidelity, the program adds the minus sign, in case of positive fidelity the plus sign. The value of u has negative values in case of negative fidelity and positive value in case of positive fidelity. It is close to zero in case of species independence of the vegetation unit. Fisher’s exact test calculates probability of species occurrence being concentrated in the vegetation unit. Fidelity is inversely proportional to this probability. In phytosociological datasets, the probabilities are often very close to zero, therefore –log of the probabilities is calculated in JUICE. While the values of the above mentioned measures increase with the increasing dataset size, phi coefficient is independent of the total number of relevés in the dataset. It ranges from – 1 to + 1, and can be used for comparing fidelity values obtained from datasets of different size.
Default options in JUICE include adjusted u value for hypergeometric model and phi coefficient. Note that only u values > 2 are statistically significant, so lower values should not be given ecological interpretation; species with u values for particular vegetation unit lower than 2 should not be considered as diagnostic. As the u value increases with the dataset size; lower u values are particularly attained in small datasets (in very small datasets, the highest u values may not exceed 2). Thus, u value is important if we want to control statistical significance of fidelity. In cases where we are interested in comparing fidelities calculated in datasets of different size, it is better to use phi coefficient. For further details of fidelity measures we refer to Chytrý et al. (2002).
|
|
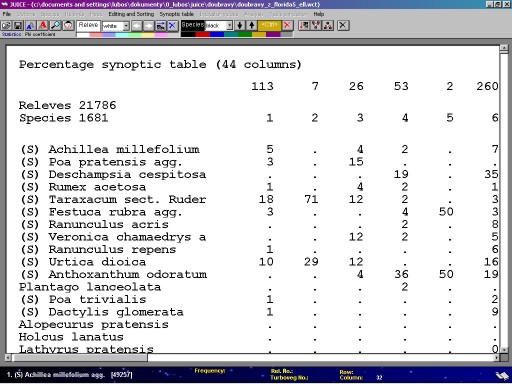
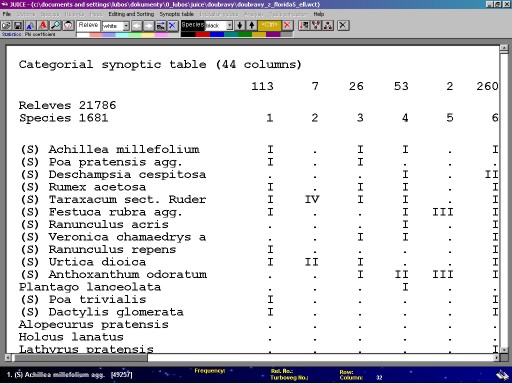
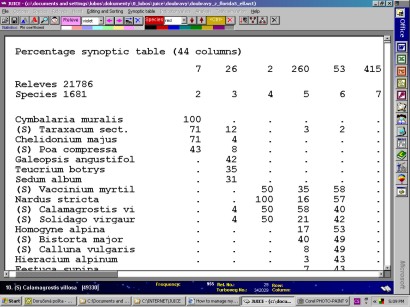
The program supports the display of synoptic columns as:
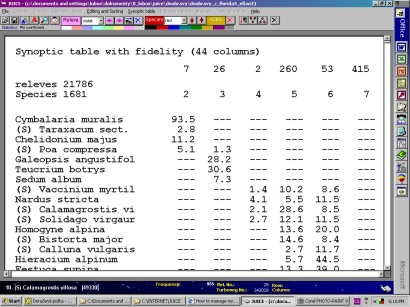
The first four options are standard formats of synoptic table display used in phytosociological literature. However, the presentation of synoptic table with fidelity has an additional information - this value can clearly distinguish diagnostic species of each column while the frequency informs only about the constance. Sorts of constancy columns by fidelity can identify diagnostic species of vegetation units and move them to he upper part of the table. More informations about the importance of synoptic tables with fidelity values is written in Chytry et al. (2002).
Note: In the case of negative fidelity, species is indicated by ---; dots denote missing species, as in the case of traditional synoptic tables with frequencies.
Species sorting in a synoptic column
| Synoptic
tables are usually sorted so that species with high
frequency or fidelity in particular columns (vegetation
units) are placed together, to form groups of diagnostic
species. In traditional synoptic tables, these species
are usually sorted by decreasing frequency in the
vegetation units; JUICE includes a procedure of fidelity
sorting, which ranks the species by decreasing fidelity,
i.e. decreasing diagnostic capacity for particular
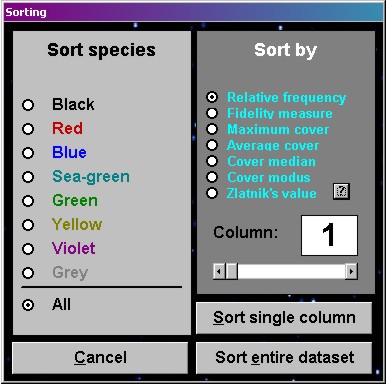
vegetation units. The sorting form appears after selecting SYNOPTIC TABLE and SPECIES SORTING IN SYNOPT. TABLE. This form supports sorting of species with the currently selected colour, or of all the species in the table, by (a) species frequency, (b) fidelity or (c) maximum cover. The button Sort single column sorts only one synoptic column selected by horizontal scroll bar. The button Sort all data set prompts the user to fill in a threshold value of frequency, fidelity, or cover for the species to be sorted. Species not exceeding this threshold value are moved to the unsorted bottom part of the table. Warning! This function repaints colours of all species. |
|
Presence of diagnostic, constant (frequent), and dominant species can be detected in each synoptic column. From the menu SYNOPTIC TABLE and ANALYSIS OF SYNOPTIC TABLE the respective form with three (initially empty) lists occurs. Fill in appropriate fidelity cut value, frequency and/or cover thresholds, choose the column to be analysed, then press Refresh to fill the list boxes below. To analyse the next vegetation unit, select the number of synoptic column by the horizontal scroll bar and press the Refresh button.
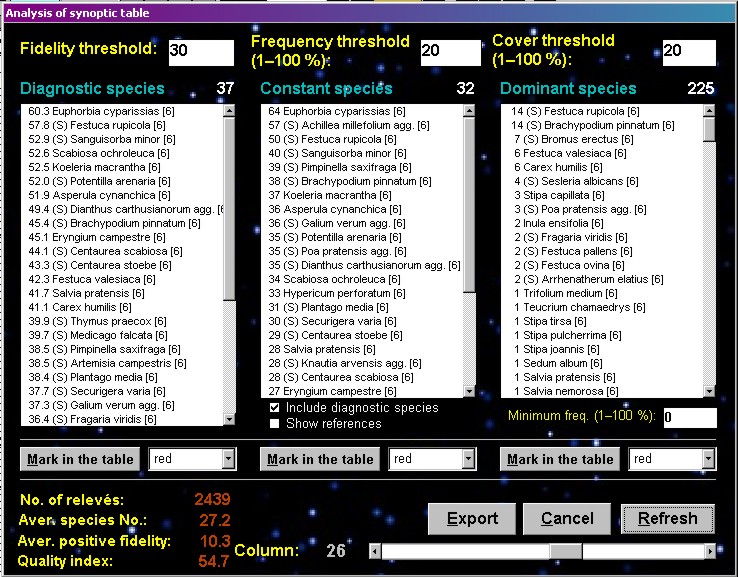
Contents of list boxes
The first list box displays diagnostic species whose fidelity is higher than the threshold written above the box.
The second list box displays constant species whose minimum percentage frequency is higher than the threshold shown. You can include or exclude diagnostic species in this list by clicking the check box below.
The third list box shows dominant species whose minimum cover value is higher than the threshold shown. The values next to the species name are the percentage frequency in the vegetation unit of relevés, in which the species cover is higher than the threshold.
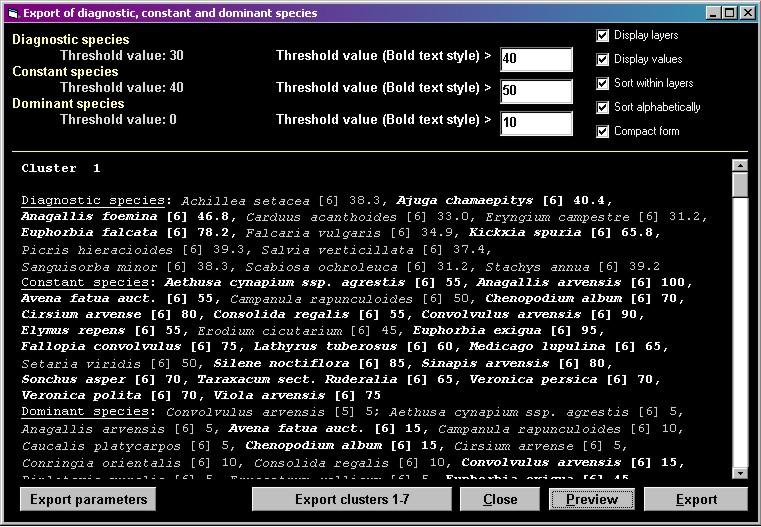
Exports to the RTF format
Export form allows to prepare results for final export to Rich Text Format file which had to be initialised in the menu FILE and EXPORT and CURRENT FILE:... Store display parameters and threshold values for species which will be written as bold.
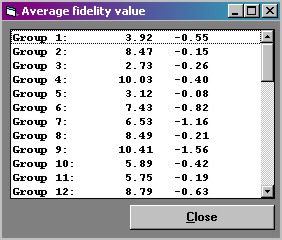
Quality of delimitation of vegetation unit
| This function calculates the average of positive fidelity values for all species of the vegetation unit. This average is high if many species have their occurrence concentrated in the vegetation unit, and is relatively low if the vegetation unit mostly includes generalist species with a broad ecological range. The function is called from the menu SYNOPTIC TABLE and AVERAGE FIDELITY. |
|
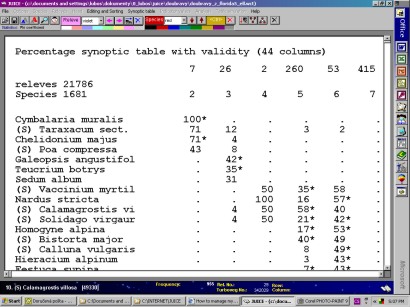
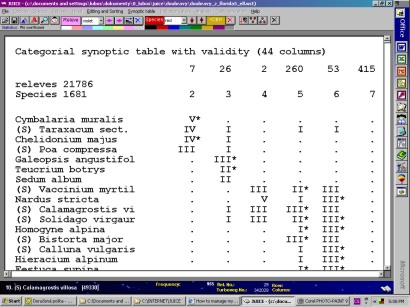
This advanced function shows synoptic tables with percentage frequencies or frequency categories, with all species with fidelities higher than a selected threshold indicated by an asterisk. The function is called from the menu SYNOPTIC TABLE and PERCENTAGE WITH VALIDITY or CATEGORIES WITH VALIDITY. Enter an appropriate u-value threshold, which will depend on the maximum u-value shown.
Percentage values
|
Fidelity values
|
Percentage values with validity (fidelity threshold)
|
Categorial values with validity (fidelity threshold)
|