

Hot news in March 2010:
gnuplot 4.4.0 has been released! Download and enjoy it!
Hot news in September 2004:
gnuplot 4.2.4 has been released! Download and enjoy it! Considerably improved,
many more nice features (as mentioned below).
You can download the latest official version:
gnuplot 4.2.x
There are a lot of nice as well as important improvements. Be sure to read the documentation as well as the web page www.gnuplot.info. (mainly if you have not followed the gnuplot development for a long time).
Cool: mouse support for OS/2 PM was available as a patch to gnuplot 3.6 pl 336 (April 1998), then it was integrated in the development beta version series since gnuplot 3.7.0.6, and X11 mouse has been added since gnuplot 3.8c. Then it has been integrated to the sources available through SourceForge.
Cool - previous: gnuplot OS/2 PM terminal comes to you with mouse support! OS/2 was the first platform having mouse support in gnuplot --- since spring 1998. The mouse support for X11 terminal is available since January 2000. Here is the first announcement of both PM + X11 mouseable terminals as released on January 21, 2000:
ANNOUNCEMENT OF MOUSE SUPPORT FOR PM AND X11 TERMINALS
------------------------------------------------------

		Hello everybody,

We worked hard in the last weeks (months...) to get the best of two different
mouse versions merged.  Note that the OS/2 PM terminal is mouse-capable since
March 1998, and we have been running mouseable X11 terminal since October 1999.
Those two versions were rewritten in order to be open for an easy accomodation
of mouse capabitities of other terminals (move of most functions from
stand-alone terminals to gnuplot core and an addition of new terminal entries.)
Now we have got the enclosed mouse-capable version which works (again) in PM
and X11 terminals.

The usage of the mouse is mainly self-explanatory.  Just type 'h' in the
graph window (hereafter we mean either PM or X11 terminal window) and a short
overview of commands will pop up.  The mouse is turned on and off with the
hotkey 'm'. The mouse is *on* by default unless turned off in the gnuplot
startup script. Furthermore, the PM terminal contains a menu where some of the
mouse actions are available via mouse click; in addition, OS/2 can run both
mouseable PM and X11 terminals (simultaneously :-).


Besides the mouse stuff, some additional topics were implemented:

 -  a `bind' command to bind `hotkeys' to any gnuplot commands.
    see `help bind'. Some keys are pre-bound to builtin functions
    which can be overridden.
 -  a configurable mouse behaviour via `set mouse'.
    see `help mouse'.
 -  added an `else' to the `if' command.
    see `help if'.  This was mainly done to enable toggle
    actions for the `bind' command.
 -  added an `set historysize' command when using gnu readline.
    see `help historysize'.
 -  added a `set term x11 driver <path>' option to the x11 driver.
    This enables changing of the default driver name `gnuplot_x11'.
    The default driver name can also be changed at compile time
    by the option --with-X11-driver=<path>. This is useful, if
    several gnuplot versions exist on one system. See `help x11'.
 -  added `set term x11 [no]persist' and `set term x11 [no]raise'
    options to the x11 driver. Setting these will override the
    command line or Xresource settings. (Un)setting these will
    take immediately effect, so the behaviour of an open x11
    driver's window can be changed.
  - introduced a `set label <label options> pointstyle <style>' option.
    If this option is set, a point with <style> (like pointstyles in
    other commands) is drawn at the selected position and the text is
    displaced a bit.  The size is taken from `set pointsize'. This
    option is used when plotting permanent labels with Button 2.


NOTE that we carefully updated the docs (gnuplot.doc), so if you're
in doubt, you should always be able to do `help <keyword>`.


COMPILING:

Unix:
  The mouse must be enabled at compile time:
  ./configure --enable-mouse [other configure options] ...
  make
  make install

OS/2:
  Mouse support is compiled in if MOUSE=1 is present in makefile.os2
  (the default).


TECHNICAL DETAILS:

  On OS/2, the communication between gnupmdrv and gnuplot is implemented by
  shared memory and an event semaphore.  On Unix, we decided to use a
  bidirectional pipe for (ipc communication).  The readline interfaces were
  modified to listen to both stdin and the ipc file descriptor.  (Well, that's
  just the usual way).  Note that if compiling with gnu readline, you must
  have a gnu readline version > 2.2 (3.0).  This will not be a major drawback,
  as 2.2 is out for years now and the current gnu readline version is 4.0.
  The communication code is located in gpexecute.inc.

  For splots (3d) the data is cached and can therefore be redrawn
  very quickly.  This enables smooth rotating and zooming of splots.

  The X11 part is kept as *simple* as possible -- using the
  default font and color, no fancy toolkit widgets ...


OUTLOOK (TODO):

 - implement a binary protocol for X11 (note: protocol of PM is binary). This
   is supposed to speed up things considerably, especially for large 3d plots.


Comments are welcome!

Petr Mikulik <mikulik@physics.muni.cz>
Pieter-Tjerk de Boer <ptdeboer@cs.utwente.nl>
Johannes Zellner <johannes@zellner.org>

January 21, 2000
Here is the old text for PM and X11 mouse capabilities. No time to update it, sorry...but enjoy the figures, at least.
I have patched gnuplot's PM terminal for mouse support. The pm terminal possesses the following new functions with respect to the "original" PM (Presentation Manager, not Petr Mikulik's, of course) terminal:
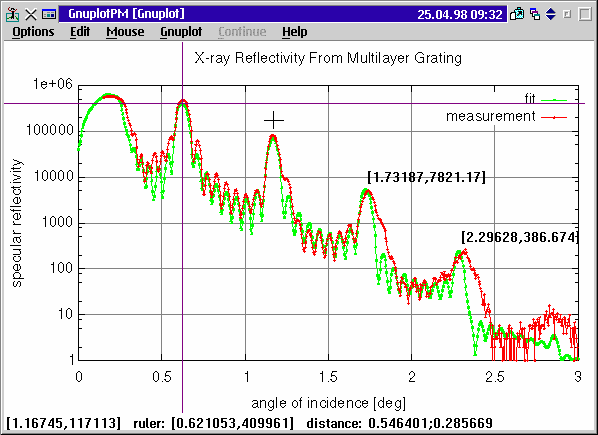
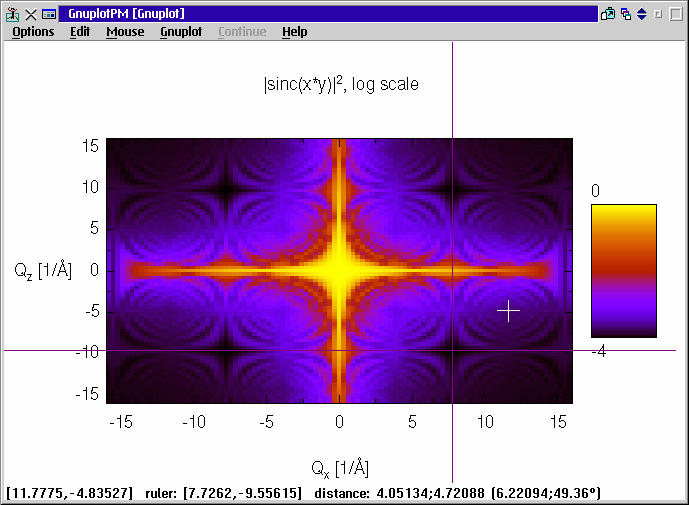
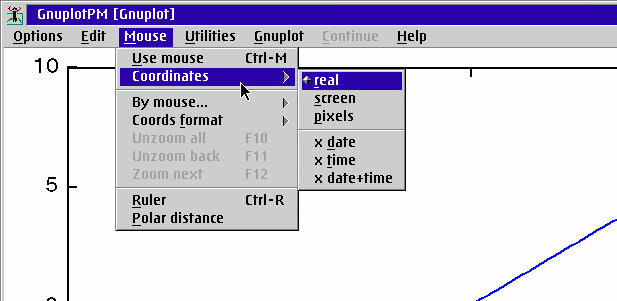
Here is a snapshot of the mouse menu:
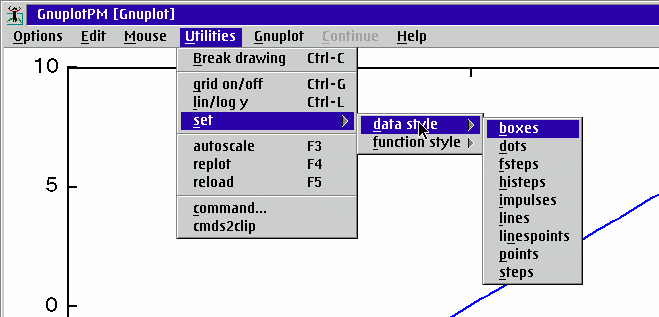
and here the utils menu:
Current version: get and compile the development version.

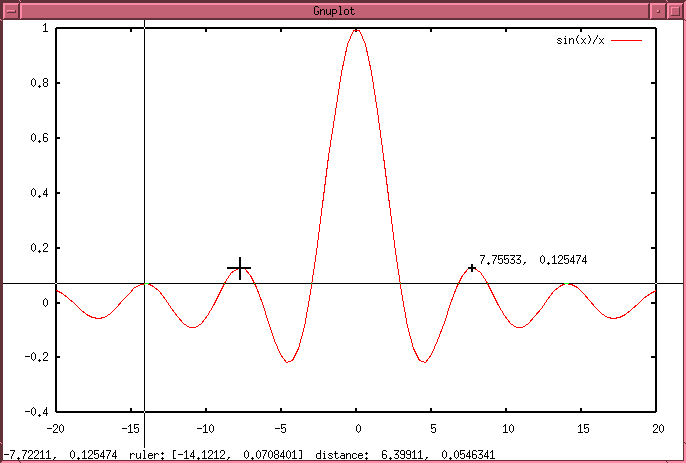
Cool: gnuplot's X11 terminal comes to you with mouse support (November 1999)! The X11-specific work has been done by Johannes Zellner and Pieter-Tjerk de Boer. The same mouse functionality has been achieved for both PM and X11 terminals. In addition, the X11 terminal lets you interactively (by mouse) change view and zoom of splots.
Original text (mostly from winter/spring 1999):
I'd like to announce here a new type of splot mode: pm3d. This adds the
possibility to draw colour/gray maps and surfaces to contours and wired
surfaces currently supported.
I tried to implement my pm3d algorithm developed already in my programs
pm3d and pmgraf
(see the snapshots there).
pm3d relies on new terminal entries for filled colour polygons and palette of smooth colours. This is now implemented for these terminals:
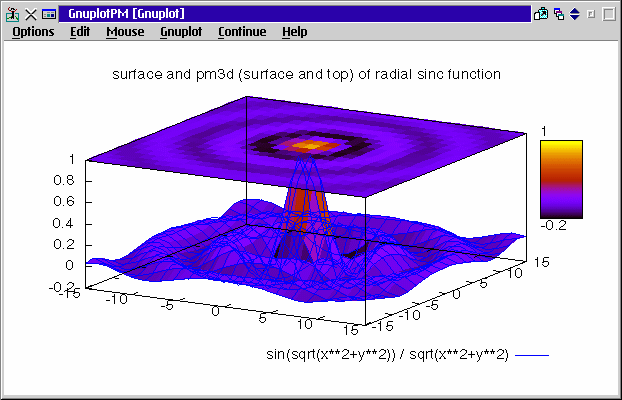
Capturing PM terminal window plotted by the script
set pm3d at st
#set grid
set key below
set border 4095
set surface
set samples 25
set isosamples 20
set ticslevel 0
set title "surface and pm3d (surface and top) of radial sinc function"
splot [-15:15.01] [-15:15.01] [-0.2:1] \
  sin(sqrt(x**2+y**2)) / sqrt(x**2+y**2)
gives:
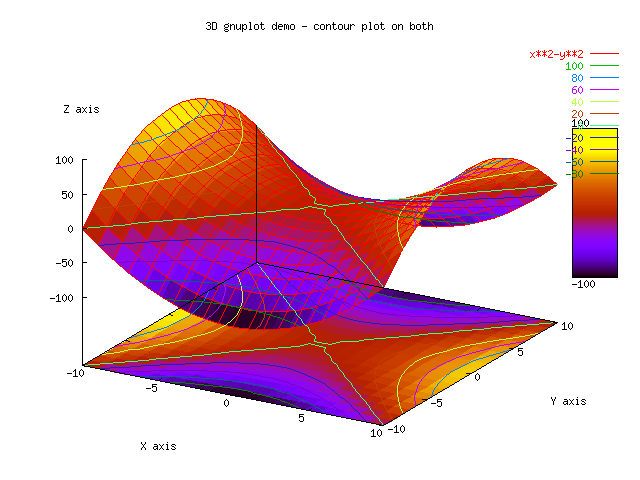
Here comes one of the demo figures from contour.dem plotted with
set pm3d at bs into the gif terminal:
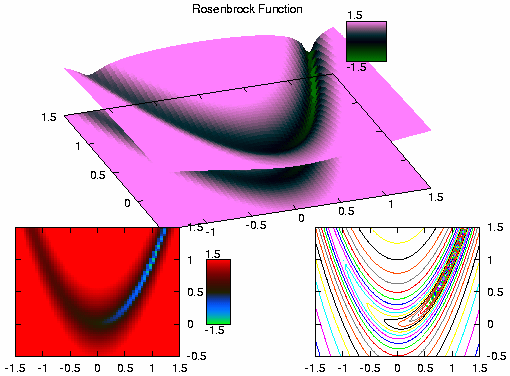
The next figure shows the Rosenbrock valley as in the gnuplot demo directory.
There is a multiplot mode with pm3d on bottom and surface (top figure), pm3d
colour map (that's what is my pm3d program
doing) on left, and the usual contour map (i.e. no pm3d) on right. The output file was
postscript and rastered into bitmap by ghostcript. The colour formulae (see doc)
of the smooth colours are 21,11,6 for the upper figure and 7,5,15 for the left
figure (this was changed by hand in the postscript file---i.e. just three numbers
changed). So look:
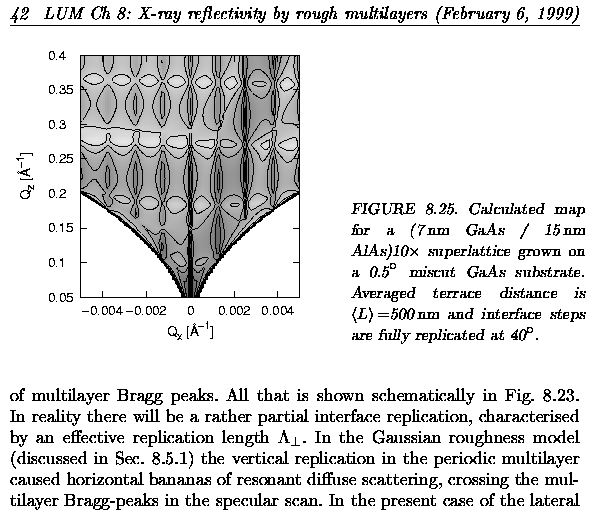
The following figure, published in
this review article,
shows the simultaneous use of the pm3d mode and contour map:
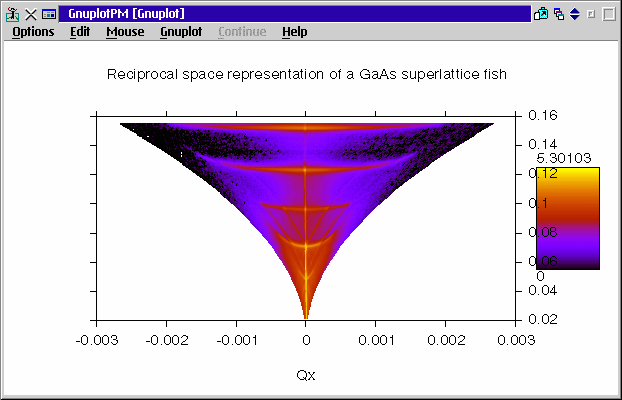
And what about the reciprocal space representation of our famous
GaAs fish? (This result from
an x-ray reflectivity synchrotron measurement is far from being small
equidistant grid: there are 189 scans with 21 to 397 points, and having
39501 points altogether). The following is a capture of PM terminal window:
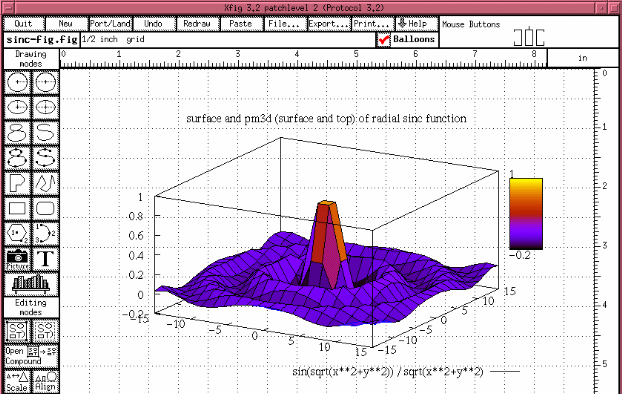
pm3d functionality for the fig terminal has been added by
Ian MacPhedran.
Here is a partial capture of the Xfig 3.2 window (running under XFree86-OS/2):
How to download the current development source code
Up-to-date source code of gnuplot (development version of gnuplot, series 4.0)
resides at
SourceForge group gnuplot (group_id=2055).
Execute the following to download sources (it requires program cvs, not ftp!):
  export CVSROOT=:pserver:anonymous@cvs.sourceforge.net:/cvsroot/gnuplot
  cvs login
  cvs -z3 checkout gnuplot
Compiling this development version of gnuplot on Unix can be done from inside gnuplot source directory by the following commands:
  ./prepare

  # Choose one, or add any other option as listed by "./configure --help":
  ./configure			   # if you are root: installs to /usr/local
  ./configure --prefix=$HOME/usr   # single-user installation to $HOME/usr

  make

  make install-strip
Note 1: Command ./prepare creates the configuration script ./configure, and it requires some newer version of autoconf package.
Note 2: single-user installations requires presence of directories $HOME/usr/bin, $HOME/usr/lib, $HOME/usr/man, $HOME/usr/info, and $HOME/usr/share. Then you should have $HOME/usr/bin listed in your PATH first, e.g. in your $HOME/.profile you need
PATH=$HOME/bin:$HOME/usr/bin:$PATH
Note 3: You can install gnuplot through rpm package system by
checkinstall make install-strip...it requires package checkinstall, which may be a part of your Linux distribution. This way you can easily deinstall this new gnuplot any later.
Note 4: Please read docs and run demos to see how it works. (FAQ: pm3d does not plot my datafile! Answer: there are no blank lines in between subsequent scans / isolines. Read docs and look to demos!)
For other operating systems, use the prepared Makefile.* in directory gnuplot/config. Read also INSTALL for more details (actively maintained are Makefiles for OS/2, Windows, and probably some others; you are welcome to contribute for other operating systems). Binaries for these systems are not provided---it is develoopment version, and you are supposed to compile gnuplot yourself if you really want it (well, compiling it is easy). You may find some precompiled binaries at some places, like here (for OS/2 and Windows) -- but always: notice that the "latest precompiled binaries" are *always* older than the current development sources, so if you notice any problem, please get and recompile up-to-date gnuplot yourself it is easy, and don't report bugs found in such obsolete binaries.
You can read this announcement where some more details about gnuplot on SourceForge are described.
You may or may not experience some problems with the version of automake and autoconf you have. Versions later than automake 1.4 and autoconf-2.13 may or may not break gnuplot autoconf setup by incompatibility (autoconf-2.15 is very unfamous for its new incompatibilities).